Taxonomy assignment
Now that we have representative sequences from the denoising process (e.g. ZOTUs, ASVs, ESVs), we can assign taxonomy to them. There are several methods to do this. See the Qiime2 Overview
Methods of Taxonomy classification
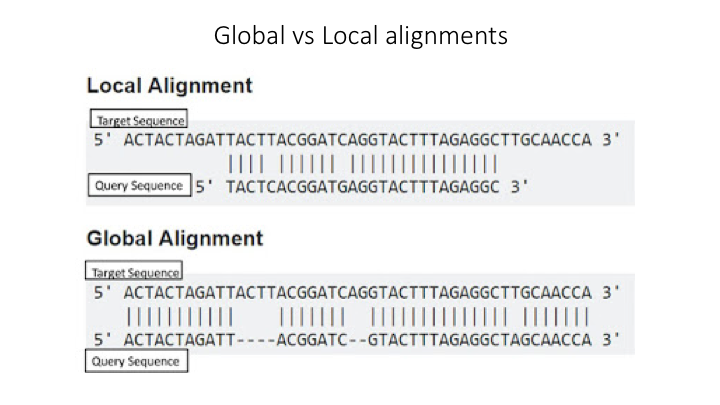
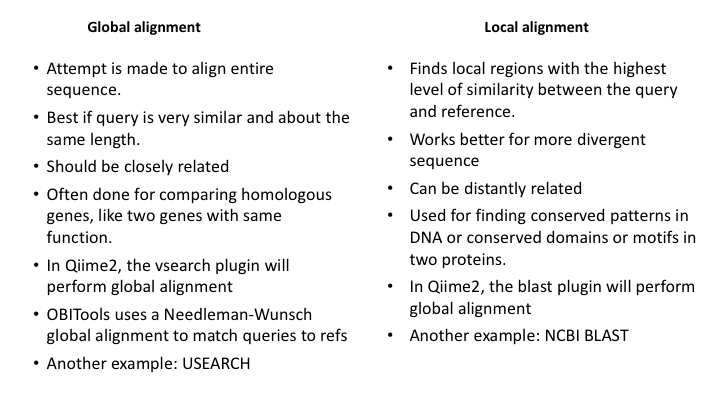
There are three basic approaches to taxonomy classification (and endless variations of each of these): Global alignment, local alignment, and Naive Bayes, or machine learning approaches in general.
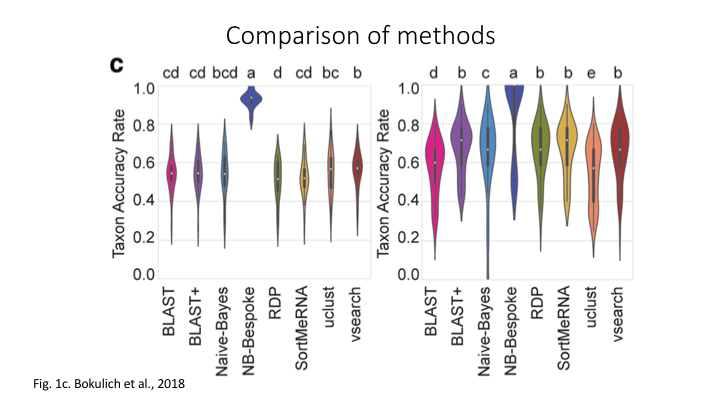
for a discussion of them see the paper.
We will start with the machine-learning based classification method, as that is generally favoured by the Qiime group (though ‘best’ is relative and will depend on many factors).
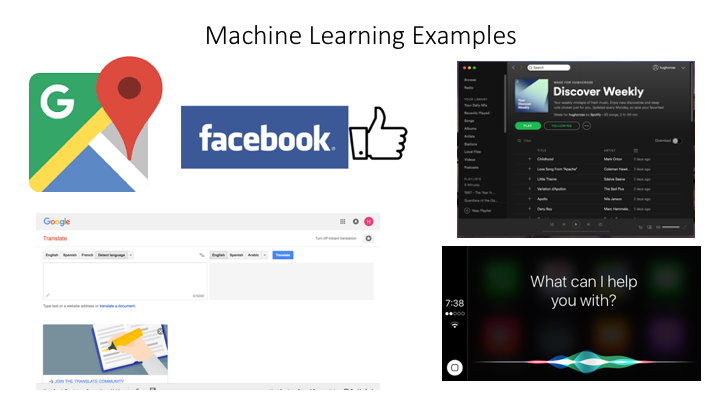
Machine Learning
Use Naive Bayes (machine learning) to classify in Qiime
In order to use the Naive Bayes (NB) method to assign taxonomy, it is necessary to train the sequence database first. Because this can take a great deal of time, a pre-trained classifier has been made available for you. The Qiime2 Data Resources page provides some pre-trained classifiers for common primer combinations, as well as links to the Greengenes and Silva databases for 16S and 18S gene studies. For additional primer combinations, or other gene references, there is a tutorial for training feature classifiers.
Use the command below, changing the name of the rep-seqs artifact that you have created:
qiime feature-classifier classify-sklearn \
  --i-classifier references/gg-13-8-99-515-806-nb-classifier.qza \
  --i-reads {REP-SEQS}.qza \
  --o-classification {TAXONOMY}.qza
You can then create a visualisation of the classification:
qiime metadata tabulate \
  --m-input-file {TAXONOMY}.qza \
  --o-visualization {TAXONOMY_VIZ}.qzv
To visualise the result:
qiime tools view {TAXONOMY_VIZ}.qzv
A barplot graph is a good way to compare the taxonomic profile among samples
qiime taxa barplot \
  --i-table {FREQ-TABLE}.qza \
  --i-taxonomy {TAXONOMY}.qza \
  --m-metadata-file sample_metadata.tsv \
  --o-visualization {TAXA-BAR-PLOTS_VIZ}.qzv
To view:
qiime tools view {TAXA-BAR-PLOTS_VIZ}.qzv
Other methods to classify
Use BLAST search to classify
Below is a command to use the BLAST classifier. With a virtual machine, this will likely use too much memory, so an output file for this is provided.
qiime feature-classifier classify-consensus-blast \
  --i-query {REP-SEQS}.qza \
  --i-reference-reads references/gg_99_reference_seqs.qza \
  --i-reference-taxonomy references/gg_99_reference_taxonomy.qza \
  --p-perc-identity 0.97 \
  --o-classification {REP-SEQS_BLAST_TAXONOMY}.qza \
  --verbose
Now generate the same visuals and compare the results from the two classification approaches